Small versions of the charts and titles are presented here with links to full size charts, links to the data for downloading into spreadsheets, and links to the PDF version suitable for overheads or handouts.
The CJSC trend charts also have links to our Crime in California, 2002 publication.
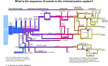 |
Criminal Justice Flowchart
PDF
|
|
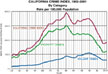
California Crime Index, 1952-2002
By Category
Rate per 100,000 Population
CHART . DATA . PDF
|
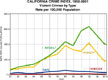 |
California Crime Index, 1952-2002
Violent Crimes by Type
Rate per 100,000 Population
CHART . DATA . PDF
|
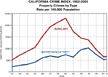 |
California Crime Index, 1952-2002
Property Crimes by Type
Rate per 100,000 Population
CHART . DATA . PDF
|
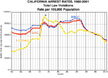 |
California Arrest Rates, 1960-2002
Total Law Violations
Rate per 100,000 Population
CHART . DATA . PDF
|
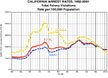 |
California Arrest Rates, 1960-2002
Total Felony Violations
Rate per 100,000 Population
CHART . DATA . PDF
|
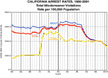 |
California Arrest Rates, 1960-2002
Total Misdemeanor Violations
Rate per 100,000 Population
CHART . DATA . PDF
|
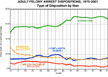 |
Adult Felony Arrest Dispositions, 1975-2002
Type of Dispositions by Year
Percent of Dispositions
CHART . DATA . PDF
|
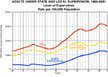 |
Adults Under State and Local Supervision, 1966-2002
Level of Supervision
Rate per 100,000 Population
CHART . DATA . PDF
|
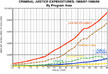 |
Criminal Justice Expenditures, 1967/68-1999/00
By Program Area
CHART . DATA . PDF
|
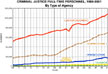 |
Criminal Justice Full-Time Personel, 1969-2002
By Type of Agency
CHART . DATA . PDF
|
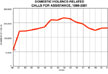 |
Domestic Violence-Related Calls for Assistance, 1986-2002
Number of Calls by Year
CHART . DATA . PDF
|
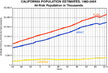 |
California Population Estimates, 1960-2002
At-Risk Population in Thousands
CHART . DATA . PDF
|
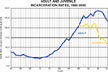 |
Adult and Juvenile Incarceration Rates, 1960-2002
Rate per 100,000 At-Risk Population
CHART . DATA . PDF
|
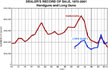 |
Dealer's Record of Sale, 1972-2002
Handguns and Long Guns
Number of Sales
CHART . DATA . PDF
|
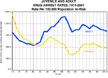 |
Juvenile and Adult Drug Arrest Rates, 1974-2002
Rate per 100,000 Population At-Risk
CHART . DATA . PDF
|
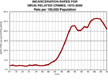 |
Incarceration Rates for Drug Related Crimes, 1970-2002
Rate per 100,000 Population
CHART . DATA . PDF
|
 |
Demographic Groups in California, 1970-2002
By Ethnicity
CHART . DATA . PDF
|
 |
Criminal Justice Time Line
1822-2000
PDF
|
 |
California Crime Clock
2002
PDF
|