|
Crime
As Reported by Selected California Agencies
January through September, 1996 and 1997
Crime As Reported by Selected California Agencies, January through September, 1996 and 1997, is a special statistical report based on preliminary crime data for the first nine months of 1997 compared to the same period in 1996. Comparisons are based on percent change in number. The data table displays the total number of crimes reported by 68 agencies. These agencies were selected because they serve populations of 100,000 or more and because preliminary data were available for the first nine months of 1997 as of December 26, 1997.

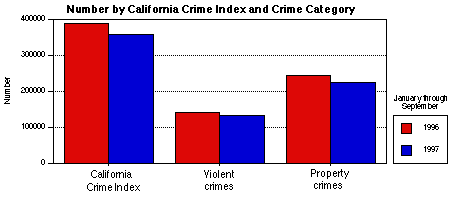
The CALIFORNIA CRIME INDEX (CCI) offenses are homicide, forcible rape, robbery, aggravated assault, burglary, and motor vehicle theft. During the first nine months of 1997, the number of reported offenses dropped 7.4 percent when compared with the same period in 1996.
CRIME IN 68 SELECTED CALIFORNIA AGENCIES
January through September, 1996 and 1997
	  			January through September
							    Percent change
Crimes				  1996		  1997		in number

California Crime Index		387,270		358,517		 -7.4

Violent crime			142,395		132,539		 -6.9
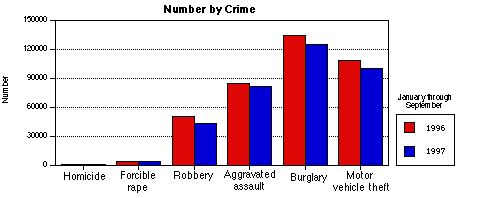
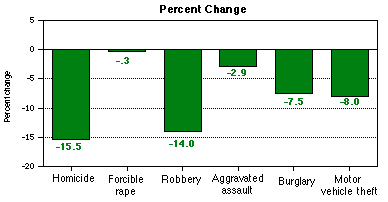
	Homicide		  1,602		  1,353		-15.5
	Forcible rape		  4,880		  4,863		  -.3
	Robbery			 50,735		 43,608		-14.0
	Aggravated assault	 85,178		 82,715		 -2.9

Property crime			244,875		225,978		 -7.7
	Burglary		135,432		125,252		 -7.5
	Motor vehicle theft	109,443		100,726		 -8.0


Notes:  1997 data are preliminary and subject to change.
	The 68 selected agencies accounted for 56.4 percent of the 1996 population
	and 61.8 percent of the 1996 California Crime Index.
	Full-year preliminary data for agencies which serve populations of
	100,000 or more will be available March 1998.
When the first nine months of 1997 were compared to the same period in 1996:
- California Crime Index crimes decreased 7.4 percent in number.
- Violent crimes decreased 6.9 percent in number.
- Property crimes decreased 7.7 percent in number.
CRIME IN 68 SELECTED CALIFORNIA AGENCIES
January through September, 1996 and 1997


DATA TABLE
The following table contains preliminary counts of crimes for the first nine months of 1997 compared to the same period in 1996. The table includes data for 68 selected California agencies serving populations of 100,000 or more.
This data table is in PDF format.
To view the table you must have an Acrobat Reader which can be DOWNLOADED FREE.
If you don't need to load the software, go directly to the PDF table by clicking here. After viewing the table, close the file (MAC) or File Exit (PC) to return to this report.
 Attorney General's Home Page Attorney General's Home Page
 CJSC Home Page CJSC Home Page
 CJSC Publications CJSC Publications
012798
|

