|
CJSC OUTLOOK
(Crime in Urban and Rural California)
View this report in the PDF format.
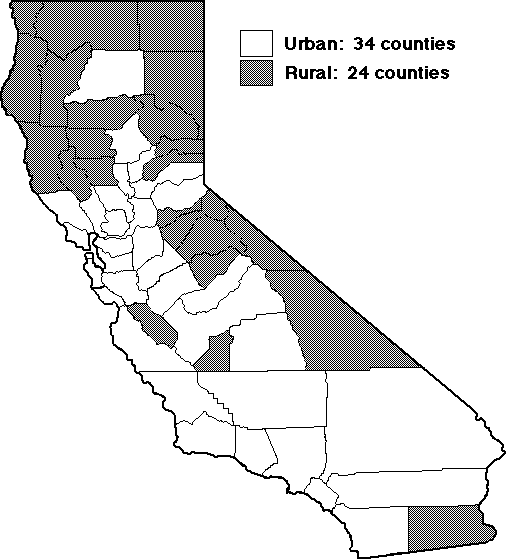
A frequent question asked is how urban crime rates compare to rural crime rates in California. Using Metropolitan Statistical Area (MSA) and Primary Metropolitan Statistical Area (PMSA) definitions provided by the California Department of Finance, Demographic Research Unit, this Outlook examines annual crime rates for urban and rural areas in California for the years 1987 through 1996. (Definitions and urban/rural county designations appear at the end of this report.)
In general, from 1987 to 1996:
- Urban areas comprised about 97 percent of the population and reported about 98 percent of the crime.
- Rural areas comprised about 3 percent of the population and reported about 2 percent of the crime.
POPULATION AND CALIFORNIA CRIME INDEX
1987 and 1996
Urban and Rural Areas
				   1987				   1996
			   Number	Percent		   Number	Percent

Total population	27,662,900	100.0		32,383,010	100.0
    Urban		26,758,500	 96.7		31,312,400	 96.7
    Rural		   904,400	  3.3		 1,070,610	  3.3

CCI offenses reported	   904,014	100.0		   828,649	100.0
    Urban		   883,611	 97.7		   807,511	 97.5
    Rural		    20,403	  2.3		    21,138	  2.6
Note: The California Crime Index (CCI) is comprised of the violent crimes of willful homicide, forcible rape, robbery, and aggravated assault and the property crimes of burglary and motor vehicle theft.
CALIFORNIA CRIME INDEX, 1987-1996
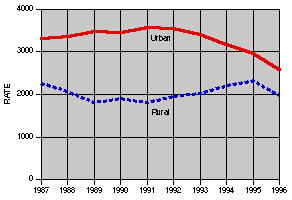
Urban and Rural Crime Rates per 100,000 Population
CRIME RATES . . .
Comparing 1987 to 1996, both urban and rural crime rates decreased (down 21.9 and 12.5 percent, respectively).
However, since 1991, the crime rate for urban areas decreased each of the five years while the rural crime rate increased for four of the five years.
VIOLENT CRIMES, 1987-1996
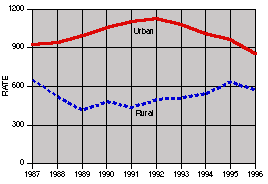
Urban and Rural Crime Rates per 100,000 Population
VIOLENT CRIMES . . .
Throughout the ten-year period, the violent crime rate for urban counties was one-half to two and one-half times greater than the rates for rural counties.
PROPERTY CRIMES, 1987-1996
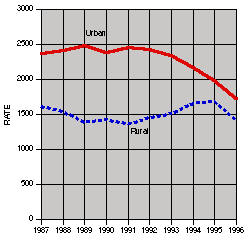
Urban and Rural Crime Rates per 100,000 Population
PROPERTY CRIMES . . .
The urban property crime rate was 47.4 percent higher than the rural rate in 1987 and only 22.4 percent higher in 1996.
Regardless of offense, urban crime rates were generally higher than rural crime rates. The only exception occurred in the burlgary cateogry where, since 1994, the rural crime rate has surpassed the urban crime rate.
The largest variance is in the robbery cateogry where urban rattes were between five and eight times greater than the rates for rural areas.
CALIFORNIA CRIME INDEX OFFENSES, 1987-1996
Urban and Rural Crime Rates per 100,000 Population
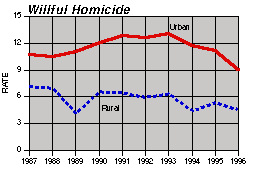
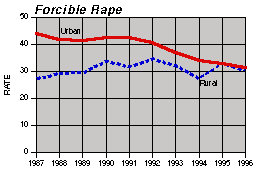
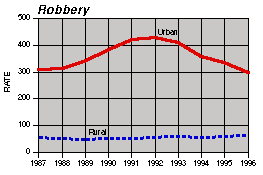
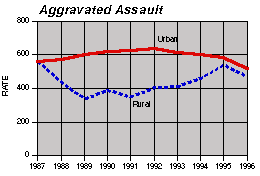
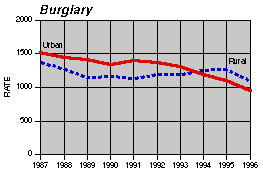
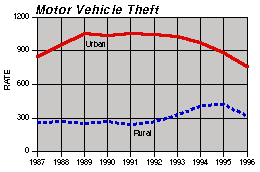
Note: Use care when comparing charts as scales vary.
For purposes of this report, the Metropolitan Statistical Areas (MSA's) of California, consisting of 34 counties, were designated as urban. A MSA is defined as a large population nucleus, together with adjacent communities that have a high degree of economic and social integration with that nucleus. Each MSA must include:
a. One city with 50,000 or more inhabitants, or
b. A Census Bureau-defined urbanized area and a total MSA population of at least 100,000.
All other counties (24) were designated rural. It is recognized that some "urban" counties may have sparsely-populated rural areas; however, for statistical comparison, entire counties have been classified as either urban or rural.
Urban counties are: Alameda, Butte, Contra Costa, El Dorado, Fresno, Kern, Los Angeles, Madera, Marin, Merced, Monterey, Napa, Orange, Placer, Riverside, Sacramento, San Bernardino, San Diego, San Francisco, San Joaquin, San Luis Obispo, San Mateo, Santa Barbara, Santa Clara, Santa Cruz, Shasta, Solano, Sonoma, Stanislaus, Sutter, Tulare, Venture, Yolo, and Yuba.
Rural counties in California are: Alpine, Amador, Calaveras, Colusa, Del Norte, Glenn, Humboldt, Imperial, Inyo, Kings, Lake, Lassen, Mariposa, Mendocino, Modoc, Mono, Nevada, Plumas, San Benito, Sierra, Siskiyou, Tehama, Trinity, and Tuolumne.
DATA TABLE
The following table contains California Crime Index - Urban and Rural Crime Rates per 100,000 Population from 1987-1996.
This data table is in PDF format.
To view the table you must have an Acrobat Reader which can be DOWNLOADED FREE.
If you don't need to load the software, go directly to the PDF table by clicking here. After viewing the table, close the file (MAC) or File Exit (PC) to return to this report.
 Attorney General's Home Page Attorney General's Home Page
 Beginning of this report Beginning of this report
 CJSC Home Page CJSC Home Page
 CJSC Publications CJSC Publications
121697
|

