|
HOMICIDE IN CALIFORNIA, 1995
The role of the Criminal Justice Statistics Center is:
- To collect, analyze, and report statistical data which provide valid measure of crime and the crimnal justice process;
- To examine these data on an ongoing basis to better describe crime and the criminal justice system;
- To promote the responsible presentation and use of crime statistics.
Highlights
Introduction
Homicide Crimes
Homicide Arrests
Dispositions of Adults Arrested for Homicide
Death Penalty Sentences
Peace Officers Killed in the Line of Duty
Justifiable Homicides
Criminal Justice Glossary
Computational Formulas
HIGHLIGHTS
CRIMES
- From 1994 to 1995, homicide crimes decreased 4.3 percent in rate per 100,000 population (11.5 vs. 11.0). In 1995, homicide crimes were 2.7 percent lower in rate than in 1986 (11.0 vs. 11.3).
- In 1995, the black homicide victim rate was over nine times that of whites and almost two and one-half times that of Hispanics (40.2 vs. 4.1 and 16.5, respectively.)
- When 1986 is compared to 1995, the homcide rate increased 55.6 percent for victims under 18 years of age. The homicide rate for victims 40 years of age and over decreased 27.2 percent.
- In 1995, the largest porportion of white victims fell into the "40 years of age or older" category (38.6 percent). The largest proportions of Hispanic and black victims fell into the "18-29 years of age" category (53.0 and 44.1 percent, respectively).
- In 1995, 65.7 percent of homicide victims knew the offender.
- Proportionately, female victims were 15 times more likely than male victims to be the spouse of the offender (19.8 vs. 1.3 percent) in 1995.
- More victims were killed by firearms in 1995 than by all other types of weapons combined (74.0 percent).
- Gang- and drug-related homicides as a proportion of total homicides increased from 18.8 percent in 1986 to 36.1 percent in 1995.
- In 1995, homicide victims under 5 years of age were most likely to be killed as a result of child abuse (80.5 percent).
- In 1995, homicide victims 5-17 years old were most likely to be killed as a result of gang- or drug-related activities (68.1 percent).
ARRESTS
- From 1994 to 1995, homicide arrests decreased 6.7 percent in rate per 100,000 population at risk (12.0 vs. 11.2). In 1995, homicide arrests were 22.2 percent lower in rate than in 1986 (11.2 vs. 14.4).
DISPOSITIONS
- Over 79 percent of adults arrested for homicide for which 1995 dispositions were received were convicted of homicide or some other offense.
- Of adults arrested for homicide for which 1995 dispositions were received, proportionately more whites than Hispanics or blacks wee convicted (85.4 vs. 76.3 and 77.7 percent, respectively).
DEATH PENALTIES
- By the end of 1995, 426 persons were under sentence of death in California. Of these, 38 were sentenced in 1995.
PEACE OFFICERS KILLED
- Since 1986, 64 peace officers have been killed in the line of duty. Ten were killed in 1995.
INTRODUCTION
Homicide in California, 1995 contains details about the crime of homicide and its victims, information about persons arrested for homicide, and the response of the criminal justice system. Information about the death penalty, the number of peace officers killed in the line of duty, and justifiable homicides is also included.
The major sections of the report are:
- Homicide Crimes
- Homicide Arrests
- Dispositions of Adults Arrested for Homicide
This publication complements the previously published Crime and Delinquency in California, 1995 in which the number of homicides committed and the type of weapon that was used were reported. Most data presented here were obtained from three data bases maintained by the Department of Justice: the Homicide File for data pertaining to both willful and justifiable homicide crimes; the Monthly Arrest and Citation Register for data pertaining to the demographic characteristics of persons arrested for homicide; and the Offender-Based Transaction Statistics system for information on types of dispositions, sentences, and death penalties. Because of the differences in the types of data collected and the methods used to collect these data, the reader is cautioned against comparing these data bases.
HOMICIDE CRIMES
Homicide is defined by the FBI's Uniform Crime Reporting (UCR) Program as the willful (nonnegligent) killing of one human being by another. The homicide category comprises murder and nonnegligent manslaughter. Attempted murder, justifiable homicide, manslaughter by negligence, and suicide are excluded. The data presented in this section of the report coincide with that definition.
Table N-1
HOMICIDE CRIMES, 1986-1995
Number and Rate per 100,000 Population
		Year(s)		Number		Rate
		1995		3,530		11.0
		1994		3,699		11.5
		1993		4,095		12.9
		1992		3,920		12.5
		1991		3,876		12.6

		1990		3,562		12.1
		1989		3,159		11.0
		1988		2,947		10.5
		1987		2,929		10.7
		1986		3,030		11.3
From 1994 to 1995:
- The homicide rate per 100,000 population decreased 4.3 percent (11.5 to 11.0).
- The number of homicides decreased from 3,699 to 3,530.
Chart 1
HOMICIDE CRIMES, 1986-1995
Rate per 100,000 Population
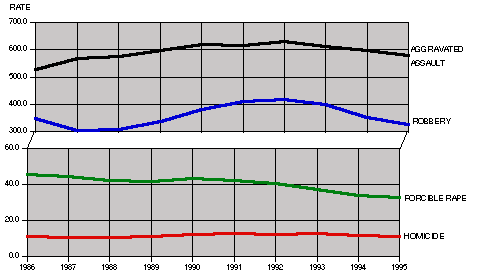
Comparing 1986 to 1995:
- The homicide rate per 100,000 population decreased 2.7 percent (11.3 to 11.0).
- The number of homicides increased from 3,030 to 3,530.
Of the four offenses classified as violent crimes by the FBI, homicide maintained the lowest rate per 100,000 population for the years shown. For comparison, changes in the rates of the violent crimes from 1986 to 1995 follow:
- Homicide decreased 2.7 percent.
- Forcible rape decreased 27.4 percent.
- Robbery decreased 5.7 percent.
- Aggravated assault increased 10.5 percent.
(The volume of aggravated assault offenses was influenced by a 1986 law change which required reporting domestic violence as criminal conduct.)
Charts 2, 3, and 4 display homicide rates per 100,000 population for victims classified by gender, race/ethnic group, and age.
Chart 2
HOMICIDE CRIMES, 1986-1995
By Gender of Victim -- Rate per 100,000 Population

Chart 3
HOMICIDE CRIMES, 1986-1995
By Race/Ethnic Group of Victim -- Rate per 100,000 Population

Chart 4
HOMICIDE CRIMES, 1986-1995
By Age of Victim -- Rate per 100,000 Population

In 1995,
- The homicide rate was 11.0 per 100,000 population.
- The male homicide rate was more than four and one-half times that of the female homicide rate (17.4 vs. 3.8).
- The black homicide rate was almost 10 times that of whites and approximately two and one-half times that of Hispanics (40.2 vs. 4.1 and 16.5, respectively).
- Homicide victims 18-29 years of age had the highest homicide rate (25.8 per 100,000 population).
Comparing 1986 to 1995:
- The male homicide rate decreased .6 percent. The female homicide rate decreased 24.0 percent.
- The white homicide rate decreased 33.9 percent. The Hispanic homicide rate increased 16.2 percent and the black homicide rate decreased 17.1 percent.
- The homicide rate increased 55.6 percent for victims under 18 years of age and 22.3 percent for victims 18-29 years of age. The homicide rate decreased 19.0 percent for victims 30-39 years of age and 27.2 percent for victims 40 years of age and over.
Chart 5
HOMICIDE CRIMES, 1995
By Gender of Victim
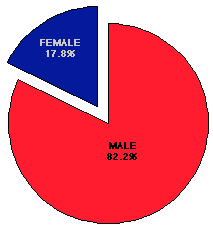
Chart 6
WILLFUL HOMICIDE CRIMES, 1986-1995
By Gender of Victim
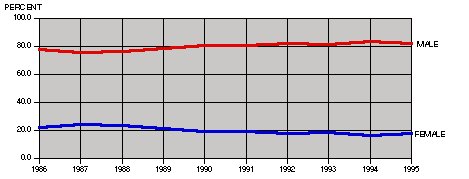
Analysis of the gender of homicide victims found that:
- In 1995, 82.2 percent were male and 17.8 percent were female.
- For each year, 1986-1995, the largest proportion of homicide victims was male. The proportions ranged from a low of 75.9 percent in 1987 to a high of 83.5 percent in 1994.
Chart 7
HOMICIDE CRIMES, 1995
By Race/Ethnic Group of Victim
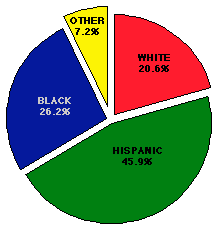
Chart 8
WILLFUL HOMICIDE CRIMES, 1986-1995
By Race/Ethnic Group of Victim
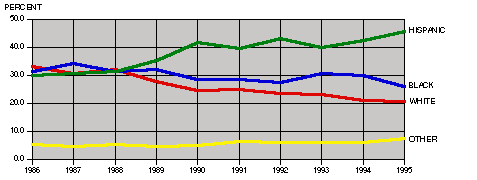
Analysis of the race/ethnic group of homicide victims found that:
- In 1995, 20.6 percent were white, 45.9 percent were Hispanic, 26.2 percent were black, and 7.2 percent fell into the "other" race/ethnic group category.
- Comparing 1986 to 1995, the proportions of white and black homicide victims decreased. The proportions of Hispanic and "other" race/ethnic groups increased.
Chart 9
HOMICIDE CRIMES, 1995
By Age of Victim
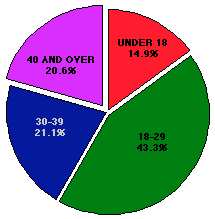
Chart 10
HOMICIDE CRIMES, 1986-1995
By Age of Victim
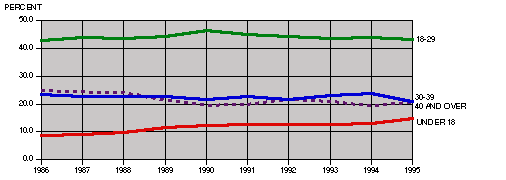
Analysis of the age of homicide victims found that:
- In 1995, 14.9 percent were under 18, 43.3 percent were 18-29, 21.1 percent were 30-39, and 20.6 percent were 40 years of age or older.
- For each year, 1986-1995, the largest proportion of homicide victims fell in the 18-29 years of age group.
Chart 11
HOMICIDE CRIMES, 1995
Race/Ethnic Group of Victim by Gender of Victim
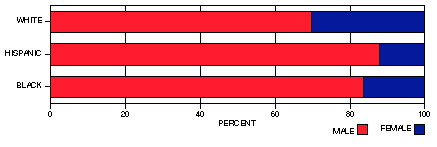
Chart 12
HOMICIDE CRIMES, 1995
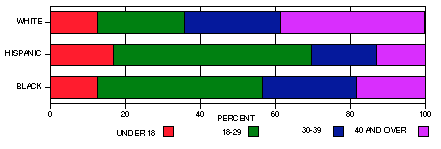
Race/Ethnic Group of Victim by Age of Victim
 In 1995,
- More Hispanic and black victims were male than white victims (88.0 and 83.5 vs. 69.8 percent, respectively).
- More white victims were female than either Hispanic or black victims (30.2 vs. 12.0 and 16.5 percent, respectively).
And,
- More Hispanic and black victims were 18-29 years of age than white victims (53.0 and 44.1 vs. 23.4 percent, respectively).
- More white victims were 40 years of age or older than either Hispanic or black victims (38.6 vs. 13.0 and 18.3 percent, respectively).
Chart 13
HOMICIDE CRIMES, 1995
By Relationship of Victim to Offender
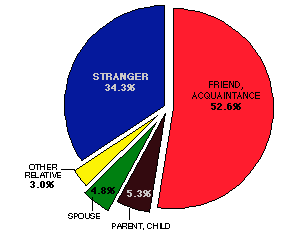
When 1995 homicide crimes were examined by the relationship of the victim to the offender, it was found that:
- 52.6 percent of victims were friends or acquaintances of offenders.
- 5.3 percent of victims were parents or children of offenders.
- 4.8 percent of victims were spouses of offenders.
- 3.0 percent of the relationships of victim to offender fell in the "other relative" category.
- 34.3 percent of victims were strangers to offenders.
Chart 14
HOMICIDE CRIMES, 1995
Gender of Victim by Relationship of Victim to Offender

Chart 15
HOMICIDE CRIMES, 1995
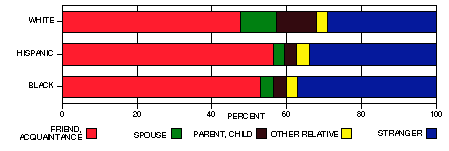
Race/Ethnic Group of Victim by Relationship of Victim to Offender
In 1995,
- Male victims were more likely than female victims to be friends or acquaintances of offenders (54.5 vs. 44.3 percent).
- Female victims were much more likely than male victims to be spouses of offenders (19.8 vs. 1.3 percent).
And,
- White victims were more likely to be spouses, parents, or children of offenders than either Hispanic or black victims (20.3 vs. 6.1 and 7.0 percent, respectively).
Chart 16
HOMICIDE CRIMES, 1995
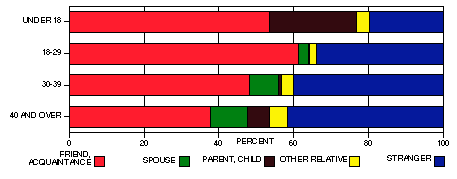
Age of Victim by Relationship of Victim to Offender
In 1995,
- Victims under 18 years of age were less likely to be strangers to offenders (19.7 percent) than victims in any other age group shown.
- Victims 18-29 years old were more likely to be friends or acquaintances of offenders (61.2 percent) than victims in any other age group shown.
- Victims 40 years of age or older were more likely to be spouses of offenders (10.0 percent) than victims in any other age group shown.
Chart 17
HOMICIDE CRIMES, 1995
County by Rate per 100,000 Population
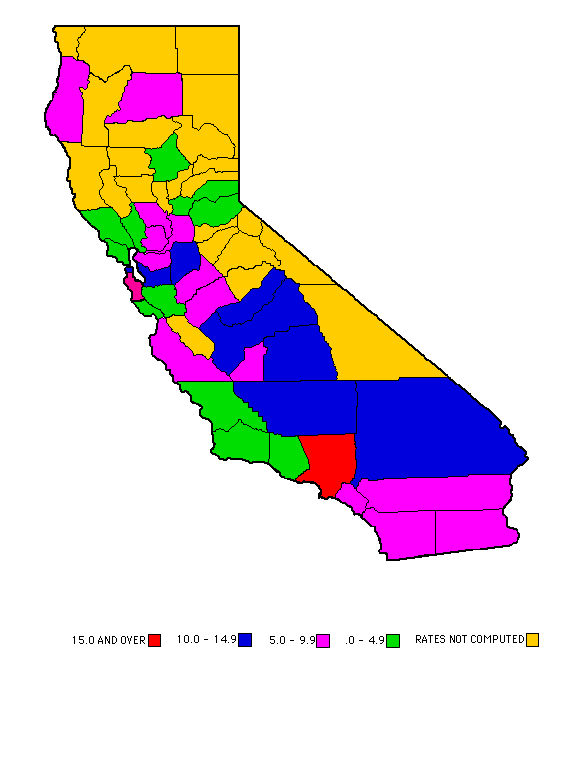
When California 58 counties were grouped by homicide rate in 1995:
- Nine counties exceeded the statewide homicide rate of 11.0 per 100,000 population. Of these, one county had a homicide rate of 15.0 and over.
- Eight counties had homicide rates between 10.0 and 14.9 per 100,000 population.
- Fifteen counties had homicide rates between 5.0 and 9.9 per 100,000 population.
- Eleven counties had homicide rates between .0 and 4.9 per 100,000 population.
- Homicide rates were not computed for the remaining 23 counties with populations of less than 100,000.
Chart 18
HOMICIDE CRIMES, 1995
By Month of Incident
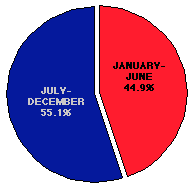
When 1995 homicide crimes were examined by the month of incident, it was found that:
- The incident that led to death occurred more often in the last six months of the year than in the first six months (55.1 vs. 44.9 percent).
- With the exception of 1987, this pattern has been found to exist each year since 1974 (Homicide in California, 1983). In 1995, the difference between the number of homicides committed from January through June (1,585) and the number committed from July through December (1,945) is the largest for the years shown.
Chart 19
HOMICIDE CRIMES, 1986-1995
January through June vs. July through December
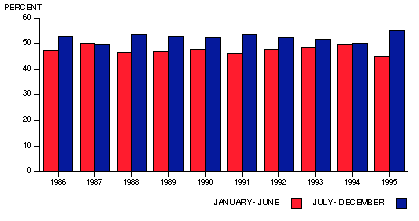
Chart 20
HOMICIDE CRIMES, 1995
Race/Ethnic Group of Victim by Day of Incident

Chart 21
HOMICIDE CRIMES, 1995
Age of Victim by Day of Incident

In 1995,
- More Hispanics than whites or blacks were killed on weekends (39.8 vs. 29.5 and 30.4 percent, respectively).
- White victims were killed most often on Fridays (16.1 percent). Hispanic and black victims were killed most often on Saturdays (20.1 and 16.2 percent, respectively).
And,
- Victims 18-29 years of age were more likely to be killed on weekends than any other age group shown (37.1 percent).
- Victims under 18 years of age and 40 years of age or older were killed most often on Saturdays (17.8 and 19.2 percent, respectively). Victims 30-39 years of age were killed most often on Fridays (16.3 percent).
Chart 22
HOMICIDE CRIMES, 1995
By Location of Homicide
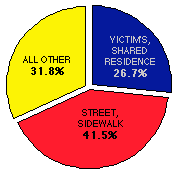
When 1995 homicide crimes were examined by location of incident, it was found that:
- 26.7 percent of victims were killed at their places of residence.
- 41.5 percent of homicides occurred on streets or sidewalks.
- 31.8 percent of homicides occurred in "all other" locations.
Chart 23
HOMICIDE CRIMES, 1995
Gender of Victim by Location of Homicide
 In 1995,
- Proportionately, many more females than males were killed at their places of residence (55.6 vs. 20.4 percent).
- Many more males than females were killed on streets or sidewalks (47.1 vs. 16.1 percent).
Chart 24
HOMICIDE CRIMES, 1995
Race/Ethnic Group of Victim by Location of Homicide
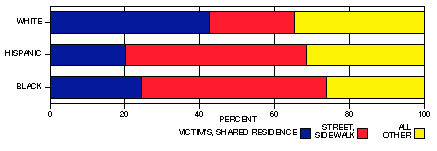
Chart 25
HOMICIDE CRIMES, 1995
Age of Victim by Location of Homicide
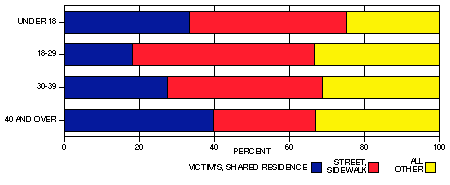 In 1995,
- Proportionately, more whites than Hispanics or blacks were killed at their places of residence (42.7 vs. 20.2 and 24.4 percent, respectively).
- More Hispanics and blacks were killed on streets or sidewalks than whites (48.2 and 49.5 vs. 22.5 percent, respectively).
And,
- More victims 18-29 years of age were killed on streets or sidewalks than any other age group shown (48.7 percent).
- More victims 40 years of age or older were killed at their places of residence than any other age group shown (39.8 percent).
Chart 26
HOMICIDE CRIMES, 1995
By Type of Weapon Used
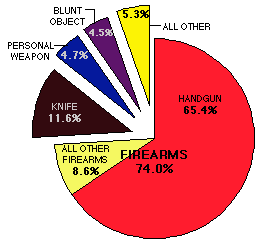
When 1995 homicide crimes were examined by the type of weapon used, it was found that:
- 74.0 percent resulted from the use of firearms.
- 11.6 percent resulted from the use of knives.
- 4.7 percent resulted from the use of personal weapons (hands, feet, etc.).
- 4.5 percent resulted from the use of blunt objects (clubs, etc.).
- 5.3 percent resulted from the use of weapons grouped in the "all other" category.
Chart 27
HOMICIDE CRIMES, 1995
Gender of Victim by Type of Weapon Used
 In 1995,
- More males than females were killed with a firearm (78.9 vs. 51.0 percent).
- Proportionately, more females than males were killed with knives, personal weapons, or blunt objects.
Chart 28
HOMICIDE CRIMES, 1995
Race/Ethnic Group of Victim by Type of Weapon Used
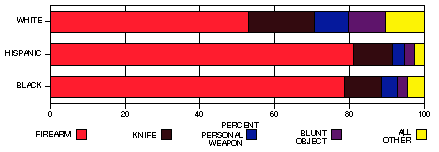
Chart 29
HOMICIDE CRIMES, 1995
Age of Victim by Type of Weapon Used
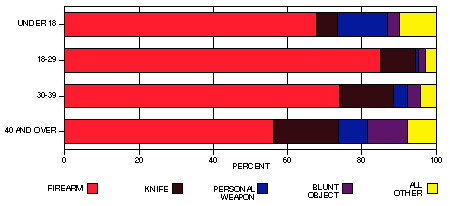 In 1995,
- More Hispanics and blacks were killed with a firearm than whites (81.0 and 78.7 vs. 53.0 percent, respectively).
And,
- More victims 18-29 years of age were killed with a firearm than any other age group shown (85.0 percent).
- Proportionately, victims 40 years of age or older were less likely to be killed with a firearm than any other age group shown (56.2 percent).
Chart 30
HOMICIDE CRIMES, 1995
By Contributing Circumstance
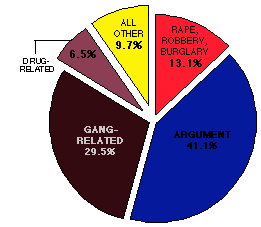
When 1995 homicide crimes were examined by contributing circumstance, it was found that:
- 13.1 percent were associated with rape, robbery, or burglary.
- 41.1 percent were associated with arguments.
- 29.5 percent were gang-related.
- 6.5 percent were drug-related.
- 9.7 percent were associated with "all other" contributing circumstances.
Chart 31
HOMICIDE CRIMES, 1986-1995
By Selected Contributing Circumstances
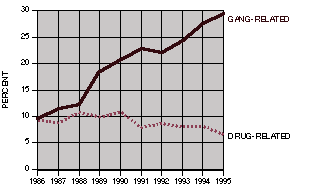
When 1986-1995 homicide crimes were examined by selected contributing circumstances, it was found that:
- The proportion of homicides in which the contributing circumstance was gang-related increased from 9.6 percent in 1986 to 29.5 percent in 1995.
- The proportion of homicides in which the contributing circumstance was drug-related decreased from 9.2 percent in 1986 to 6.5 percent in 1995.
Chart 32
HOMICIDE CRIMES, 1995
Gender of Victim by Contributing Circumstance

Note: Charts 30, 33, and 34 include rape with robbery and burglary. However, for a more meaningful comparison between male and female victims, rape is included in the "all other" category in Chart 32. In 1995, 2.5 percent of homicide crimes involving females were rape-related.
In 1995,
- Males were much more likely than females to have been victims of homicides in which the contributing circumstance was gang-related (34.1 vs. 8.2 percent).
Chart 33
HOMICIDE CRIMES, 1995
Race/Ethnic Group of Victim by Contributing Circumstance

In 1995,
- Proportionately, whites were more likely than either Hispanics or blacks to have been victims of homicides in which the contributing circumstance was an argument (55.2 vs. 37.0 and 37.7 percent, respectively).
- Hispanics and blacks were much more likely than whites to have been victims of gang-related homicides (40.8 and 32.8 vs. 4.5 percent, respectively).
Chart 34
HOMICIDE CRIMES, 1995
Age of Victim by Contributing Circumstance
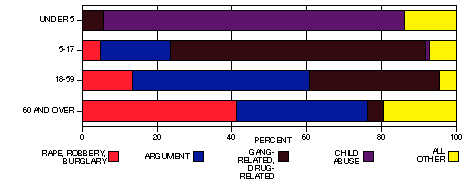
In 1995,
- Homicide victims under 5 years of age were most likely to be killed as a result of child abuse (80.5 percent).
- Homicide victims 5-17 years old were most likely to be killed as a result of gang- or drug-related activities (68.1 percent).
- Homicide victims 18-59 years old were most likely to be killed as a result of an argument (47.1 percent).
- Homicide victims 60 years of age or older were most likely to be killed as a result of rape, robbery, or burglary (41.3 percent).
 Back to the beginning of this report. Back to the beginning of this report.
HOMICIDE ARRESTS
Unlike crimes, which are classified by nationwide Uniform Crime Reporting (UCR) standards, arrests are reported by California statute definition of the offense.* This may cause some differences in the definitions of certain crimes and the reporting of the arrests for those crimes. For instance, the California definition of homicide arrests includes murder and nonvehicular manslaughter. The federal definition of homicide includes murder and nonnegligent (nonaccidental) manslaughter.
All California law enforcement agencies report arrest and citation information to the Department of Justice on the Monthly Arrest and Citation Register (MACR). The MACR lists each arrestee; includes information on age, gender, and race/ethnic group; and specifies the "most serious" arrest offense and law enforcement disposition.
*The following penal codes for homicide arrest offenses were reported to the Department of Justice during 1995: 128, 187(a), 189, 192(a), 192(b), 193(a), 193(b), 273ab, 399, 12310(a).
Chart 35
HOMICIDE ARRESTS, 1995
By Gender of Arrestee
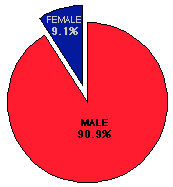
Analysis of the gender, race/ethnic group, and age of arrestees for homicide in 1995 found that:
- 90.9 percent were male.
- 9.1 percent were female.
Chart 36
HOMICIDE ARRESTS, 1995
By Race/Ethnic Group of Arrestee
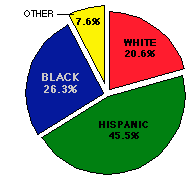
And,
- 20.6 percent were white.
- 45.5 percent were Hispanic.
- 26.3 percent were black.
- 7.6 percent fell into the "other" race/ethnic group category.
Chart 37
HOMICIDE ARRESTS, 1995
By Age of Arrestee
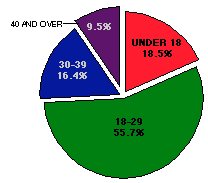
And,
- 18.5 percent were under 18 years of age.
- 55.7 percent were 18-29 years of age.
- 16.4 percent were 30-39 years of age.
- 9.5 percent were 40 years of age or older.
Chart 38
HOMICIDE ARRESTS, 1995
Race/Ethnic Group of Arrestee by Gender of Arrestee
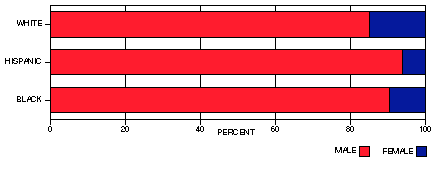
In 1995,
- Homicide arrestees for all three race/ethnic groups shown were predominately male.
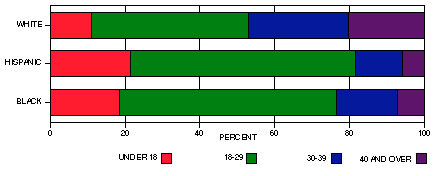
Chart 39
HOMICIDE ARRESTS, 1995
Race/Ethnic Group of Arrestee by Age of Arrestee
And,
- More white arrestees were 40 years of age or older than Hispanic or black arrestees (20.2 vs. 5.9 and 7.1 percent, respectively).
- Regardless of race/ethnic group, the majority of homicide arrestees fell into the "18-29 years of age" category.
DISPOSITIONS OF ADULTS ARRESTED FOR HOMICIDE
This section of the report describes 1995 dispositions of adults arrested for homicide, regardless of the year of arrest. Data were obtained from California's Offender-Based Transaction Statistics (OBTS) system. This system tracks the processing of adults arrested for felony offenses from arrest through final disposition using data compiled from information collected on fingerprint cards and Disposition of Arrest and Court Action (JUS 8715) forms.
Statewide adult felony arrest disposition data normally represent final dispositions for approximately 60 percent of total adult felony arrests made during a calendar year. However, due to budget reductions, the number of adult felony arrest dispositions processed for 1993, 1994, and 1995 is smaller than in prior years. Even with these data limitations it is believed that, at the statewide level, percentile data describe statewide dispositional patterns.
Chart 40
DISPOSITIONS IN 1995 OF ADULTS
ARRESTED FOR HOMICIDE
By Type of Disposition
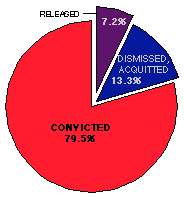
Examination of 1995 dispositions of adults arrested for homicide found that:
- 7.2 percent were released at the law enforcement level or had a complaint denied at the prosecutorial level.
- 3.3 percent were either dismissed or acquitted.
- 79.5 percent were convicted of homicide or some other offense.
Chart 41
DISPOSITIONS IN 1995 OF ADULTS ARRESTED FOR HOMICIDE
Gender of Arrestee by Type of Disposition

In 1995,
- Females were slightly more likely to be convicted than males (80.0 vs. 79.5 percent).
Chart 42
DISPOSITIONS IN 1995 OF ADULTS ARRESTED FOR HOMICIDE
Race/Ethnic Group of Arrestee by Type of Disposition
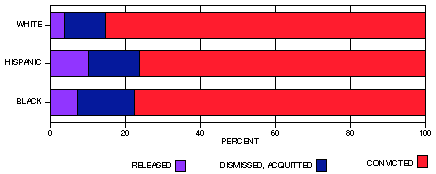
In 1995,
- Proportionately, more whites than Hispanics or blacks were convicted (85.4 vs. 76.3 and 77.7 percent, respectively).
Chart 43
DISPOSITIONS IN 1995 OF ADULTS ARRESTED FOR HOMICIDE
Age of Arrestee by Type of Disposition
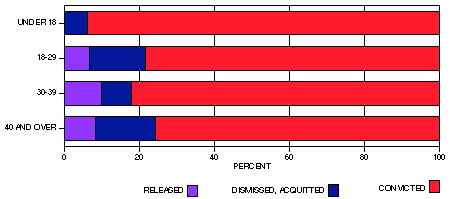
And,
- Proportionately, arrestees under 18 years of age were more likely to be convicted (94.0 percent) than arrestees in any other age group shown.
Chart 44
DISPOSITIONS IN 1995 OF ADULTS
ARRESTED FOR HOMICIDE AND CONVICTED
By Convicted Offense
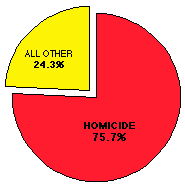
Of those adults arrested for homicide who were convicted in 1995, it was found that:
- 75.7 percent were convicted of homicide.
- 24.3 percent were convicted of lesser crimes such as robbery or assault.
Chart 45
DISPOSITIONS IN 1995 OF ADULTS ARRESTED FOR HOMICIDE AND CONVICTED
Gender of Offender by Convicted Offense

In 1995,
- More males than females were convicted of homicide (76.4 vs. 68.8 percent).
Chart 46
DISPOSITIONS IN 1995 OF ADULTS ARRESTED FOR HOMICIDE AND CONVICTED
Race/Ethnic Group of Offender by Convicted Offense
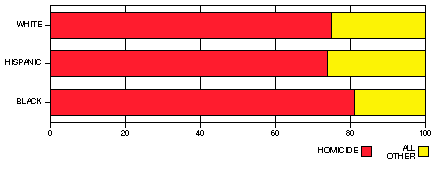
In 1995,
- Proportionately, fewer Hispanics were convicted of homicide than either whites or blacks (73.8 vs. 75.0 and 81.0 percent, respectively).
Chart 47
DISPOSITIONS IN 1995 OF ADULTS ARRESTED FOR HOMICIDE AND CONVICTED
Age of Offender by Convicted Offense
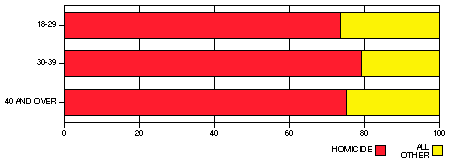
And,
- Proportionately, more arrestees 30-39 years of age were convicted of homicide (79.3 percent) than arrestees in any other age group shown.
Chart 48
DISPOSITIONS IN 1995 OF ADULTS ARRESTED FOR HOMICIDE AND CONVICTED
Convicted Offense by Sentence

Of those adults arrested for homicide who were convicted in 1995, it was found that:
- 94.4 percent of those convicted of homicide and 65.4 percent of those convicted of lesser offenses received sentences to prison or the California Department of the Youth Authority. Note: Prison includes 1995 death penalty dispositions for adults arrested for homicide. See the following section for additional information about death penalty sentences.
DEATH PENALTIES
This section contains information about persons sentenced to death in California superior courts in 1995. Death penalty information was extracted from the 1995 Offender-Based Transaction Statistics (OBTS) system. For detailed information regarding the death penalty and the criteria by which a person can be sentenced to death, refer to California Penal Code sections 190 through 190.9.
Chart 49
PERSONS UNDER CALIFORNIA
SENTENCE OF DEATH, 1978-1995
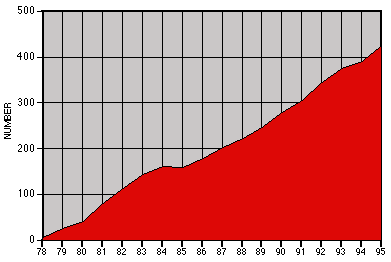
During 1995, 38 persons were convicted of first degree murder and sentenced to death. These were initial death sentences only and do not include persons who were resentenced to death after their death sentences were reversed on appeal. By the end of 1995, 426 persons were under sentence of death in California.
Of the 38 persons newly sentenced to death in 1995:
- 36 were male.
- 2 were female.
- 19 were white.
- 4 were Hispanic.
- 13 were black.
- 2 fell into the "other" race/ethnic group category.
- The mean (average) age at arrest was 28.
- Los Angeles County sentenced the largest number: 13.
Additional information can be found in Tables 43 and 44 in the Data Section of the printed copy of this report.
PEACE OFFICERS KILLED
Information about peace officers killed in the line of duty was obtained from the Homicide File. Only sworn officers are included. (Non-sworn officers, such as security guards, are excluded.)
Data in Table N-2 show that:
- From 1986-1995, 64 peace officers were killed in the line of duty.
- On average, 6.4 peace officers were killed annually. In 1995, the number was 10.
Table N-2
PEACE OFFICERS KILLED
IN THE LINE OF DUTY, 1986-1995
				    Number of
			Year(s)	  officers killed
			Total		64

			1995		10
			1994		 9
			1993		 8
			1992		 5
			1991		 3

			1990		 5
			1989*		 5
			1988**		 9
			1987		 4
			1986		 6

*Includes 1 reported federal law enforcement officer.
**Includes 2 reported federal law enforcement officers.
Data in Tables N-3 and N-4 show that:
- In 1995, all ten peace officers killed in the line of duty were male. Eight peace officers were white, one was Hispanic, and one was black.
- In 1995, all ten peace officers killed in the line of duty were killed by firearms - five by handguns, four by rifles, and one by a shotgun.
Table N-3
PEACE OFFICERS KILLED
IN THE LINE OF DUTY, 1995
Race/Ethnic Group of Officer by
Gender of Officer
					  Gender
	Race/ethnic
	    group		Total	Male	Female
	Total			  10	 10	   0

	    White		   8	  8	   0
	    Hispanic		   1	  1	   0
	    Black		   1	  1	   0
Table N-4
PEACE OFFICERS KILLED
IN THE LINE OF DUTY, 1995
By Type of Weapon
	  Type of
	weapon used	Total	     Offender's	     Officer's
	Total		  10		9		1

	    Handgun	   5		4		1
	    Rifle	   4		4		0
	    Shotgun	   1		1		0
 Back to the beginning of this report. Back to the beginning of this report.
JUSTIFIABLE HOMICIDES
A justifiable homicide is defined by the Uniform Crime Reporting (UCR) Program as the killing of a felon by a private citizen or by a peace officer during the commission of a felony. Justifiable homicides are sometimes referred to as excusable or noncriminal homicides.
When justifiable homicides committed by peace officers or private citizens in 1995 were examined, it was found that:
- Most felons killed by peace officers were male (120 in number or 98.4 percent).
- Most felons killed by private citizens were also male (59 in number or 98.3 percent).
- Most felons killed by peace officers fell into the "18-29 years of age" category (51 in number or 41.8 percent).
- Most felons killed by private citizens also fell into the "18-29 years of age" category (30 in number or 50.0 percent).
Chart 50
JUSTIFIABLE HOMICIDES BY PEACE OFFICERS OR PRIVATE CITIZENS, 1995
By Gender of Deceased

Chart 51
JUSTIFIABLE HOMICIDES BY PEACE OFFICERS OR PRIVATE CITIZENS, 1995
By Race/Ethnic Group of Deceased

Chart 52
JUSTIFIABLE HOMICIDES BY PEACE OFFICERS OR PRIVATE CITIZENS, 1995
By Age of Deceased

When justifiable homicides committed by peace officers or private citizens in 1995 were examined by location, it was found that:
- Most felons were killed by peace officers on a street or sidewalk (78 in number or 63.9 percent).
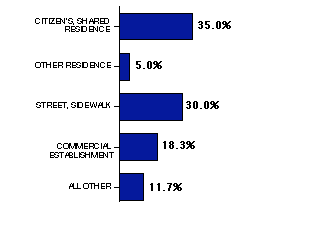
- Most felons killed by private citizens fell into the "citizen's, shared residence" category (21 in number or 35.0 percent).
Chart 53
JUSTIFIABLE HOMICIDES BY PEACE OFFICERS, 1995
By Location of Homicide
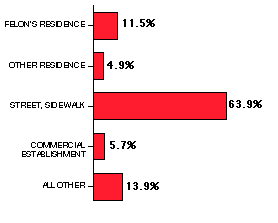
Chart 54
JUSTIFIABLE HOMICIDES BY PRIVATE CITIZENS, 1995
By Location of Homicide
When justifiable homicides committed by peace officers or private citizens in 1995 were examined by contributing circumstance, it was found that:
- Most felons were killed by a peace officer while attacking the officer (89 in number or 73.0 percent).
- Of felons killed by a private citizen, 30 in number (or 50.0 percent) were killed while attacking the citizen and 30 in number (or 50.0 percent) were killed during the commission of a crime.
Chart 55
JUSTIFIABLE HOMICIDES BY PEACE OFFICERS, 1995
By Contributing Circumstance
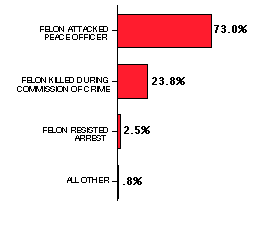
Chart 56
JUSTIFIABLE HOMICIDES BY PRIVATE CITIZENS, 1995
By Contributing Circumstance

 Back to the beginning of this report. Back to the beginning of this report.
DATA SECTION
CRIMINAL JUSTICE GLOSSARY
A C D F H J L M O P R S U V Y
ACQUITTAL: a judgment of a court, based either on the verdict of a jury or a judicial officer, that the defendant is not guilty of the offense(s) for which he/she was tried.
ADULT: a person 18 years of age or older.
AGGRAVATED ASSAULT: an unlawful attack or attempted attack by one person upon another for the purpose of inflicting severe or aggravated bodily injury. This type of assault usually is accompanied by the use of a weapon or by means likely to produce death or great bodily harm (UCR definition).
APPEAL: a petition initiated by a defendant for a rehearing in an appellate court regarding a previous sentence or motion.
ARREST: ". . . taking a person into custody, in a case and in the manner authorized by law. An arrest may be made by a peace officer or by a private person" (834 PC).
ARREST RATE: the number of arrests per 100,000 population. See Computational Formulas following this glossary for further explanation.
CALIFORNIA DEPARTMENT OF THE YOUTH AUTHORITY (CYA): the state agency which has jurisdiction over and maintains institutions as correctional schools for the reception of wards of the juvenile court and other persons committed from lower and superior courts.
COMBINED CASES: cases rejected by the prosecutor in favor of other counts/cases.
COMPLAINT: a verified written accusation, filed by a prosecuting attorney with a local criminal court, which charges one or more persons with the commission of one or more offenses.
CONVICTION: a judgment, based either on the verdict of a jury or a judicial officer or on the guilty plea of the defendant, that the defendant is guilty.
CRIME: " . . an act committed or omitted in violation of a law forbidding or commanding it. . ." (15 PC).
CRIME RATE: the number of reported crimes per 100,000 general population. See Computational Formulas following this glossary for further explanation.
CYA: see California Department of the Youth Authority.
DISMISSAL: a decision by a judicial officer to terminate a case without a determination of guilt or innocence.
DISPOSITION - COURT: an action taken as the result of an appearance in court by a defendant. Examples are: adults - dismissed, acquitted, or convicted; juveniles - dismissed, transferred, remanded to adult court.
DISPOSITION - LAW ENFORCEMENT: an action taken as the result of an arrest. Examples of police dispositions are: adults - released by law enforcement, referred to another jurisdiction, or a misdemeanor or felony complaint sought; juveniles - handled within the department, referred to another agency, or referred to the probation department or juvenile court.
DISPOSITION - PROSECUTOR: an action taken as the result of a complaint requested by an arresting agency. Dispositions include granting a misdemeanor or a felony complaint or denying a complaint for reasons such as lack of sufficient evidence or complainant refuses to testify.
DIVERSION: a disposition of a criminal defendant either before adjudication or following adjudication but prior to sentencing, in which the court directs the defendant to participate in a work, educational, or rehabilitative program.
DIVERSION DISMISSED: the successful completion of a diversion program.
FELON: one who has committed a felony.
FELONY: a crime which is punishable by death or by imprisonment in a state prison (17 & 18 PC).
FILING: a document filed with the municipal court clerk
or county clerk by a prosecuting attorney alleging that
a person committed or attempted to commit a crime.
FORCIBLE RAPE: the carnal knowledge of a female forcibly and against her will. Assaults or attempts to commit rape by force or threat of force are included (UCR definition).
HOMICIDE: the willful (nonnegligent) killing of one human being by another. Murder and nonnegligent manslaughter are included (UCR definition).
JAIL: a county or city facility for incarceration of sentenced and unsentenced persons.
JUVENILE: a person under the age of 18.
LOWER COURT: the court of original or trial jurisdiction for the prosecution of persons accused of misdemeanor or certain felony offenses. Also, lower courts may sentence certain felony offenders as well as conduct preliminary hearings to determine probable cause in cases where felony offenders are subject to the jurisdiction of superior courts.
MISDEMEANOR: a crime punishable by imprisonment in a county jail for up to one year.
MONTHLY ARREST AND CITATION REGISTER (MACR): a reporting system used to collect information on adult and juvenile arrests, and citations by police and sheriffs' departments. This register contains data on arrest offenses, arrestee characteristics (age, gender, and race/ethnic group), and law enforcement dispositions.
OFFENDER-BASED TRANSACTION STATISTICS (OBTS): a system designed to collect statistical information on the various processes within the criminal justice system that occur between the point of the felony arrest of an adult and the point of final disposition.
OFFENSE: the charged offense is the crime for which the defendant was arrested or filed on by the district attorney. The convicted offense is the offense the defendant was convicted of or pled guilty to in court.
PC (PENAL CODE): the California Penal Code contains statutes that define criminal offenses and specify corresponding punishments. Criminal justice system mandates and procedures are also included.
POPULATION AT RISK: that portion of the total population, who because of like characteristics to the specific study group, are considered "at risk." For example, if one were studying juvenile arrestees, all persons between 10 and 17 years of age would constitute the at-risk population.
PRISON: a state correctional facility where persons are confined following conviction for a felony offense.
PROBATION: a judicial requirement that a person fulfill certain conditions of behavior in lieu of a sentence to confinement. See Straight Probation.
PROBATION WITH JAIL: a type of disposition given upon conviction which imposes a jail term as a condition of probation.
RATE: a comparison of a number of events to a population.
REMAND: to send back (a case) to another court for further action.
ROBBERY: the taking or attempting to take anything of value from the care, custody, or control of a person or persons by force or threat of force or violence and/or by creating fear in the victim (UCR definition).
SENTENCE: the penalty imposed by a court upon a convicted person.
STRAIGHT PROBATION: probation granted to adults without condition or stipulation that the defendant serve time in jail as a condition of probation.
SUPERIOR COURT: the court of original or trial jurisdiction for felony cases and all juvenile hearings. Also, the first court of appeal for lower court cases.
UNIFORM CRIME REPORTING (UCR): a federal reporting system which compiles crime data based on information submitted by law enforcement agencies throughout the nation. In California, the Department of Justice administers and forwards these law enforcement data to the federal program.
VIOLENT CRIMES: crimes committed against people. This category includes homicide, forcible rape, robbery, and aggravated assault.
YOUTH AUTHORITY: see California Department of the Youth Authority.
 Back to the beginning of this report. Back to the beginning of this report.
COMPUTATIONAL FORMULAS
CRIMES
Crime rate - A crime rate describes the number of crimes reported to law enforcement agencies per 100,000 total population. A crime rate is calculated by dividing the number of reported crimes by the total population; the result is multiplied by 100,000. For example, in 1995 there were 3,530 homicides in California and the population was 32,063,000. This equals a homicide crime rate of 11.0 per 100,000 general population.
	   3,530
	__________  = .00011 X 100,000 = 11.0
	32,063,000
ARRESTS
Arrest rate - An arrest rate describes the number of arrests made by law enforcement agencies per 100,000 total population or per 100,000 population considered to be at risk for arrest. Regardless of the population used, both rates are calculated in the same manner. An arrest rate is calculated by dividing the number of reported arrests by the desired population; the result is multiplied by 100,000. For example, in 1995 there were 2,821 homicide arrests. The total population was 32,063,000 and the total population at risk (10-69 years of age) was 25,122,782.
	   2,821
	___________  = .0000879 X 100,000 = 8.8 per 100,000 population
	32,063,000


	   2,821
	__________  = .0001122 X 100,000 = 11.2 per 100,000 population at risk
	25,122,782
ADDITIONAL INFORMATION
Percent change - A percent change describes a change in number or rate from one year to another. A percent change is calculated by subtracting base year data from current year data. The result is divided by base year data and multiplied by 100. For example, in 1995 the homicide crime rate was 11.0. In 1986 the homicide crime rate was 11.3. The percent change in rate from 1986 to 1995 is a 2.7 percent decrease.
	11.0 - 11.3
	__________  = .0265486 X 100 = 2.7 percent
	    11.3
Populations at risk - Arrest section data tables include three comparison populations: total (10-69 years of age), adult (18-69 years of age), and juvenile (10-17 years of age).
When a series of rates are calculated using different populations, the rate calculated for the total will not be equal to the sum of the rates calculated for each subtotal. For example, the total arrest rate (calculated using the total at-risk population) will not equal the sum of the adult arrest rate (calculated using the adult at-risk population) and the juvenile arrest rate (calculated using the juvenile at-risk population).
 Back to the beginning of this report. Back to the beginning of this report.
 If you would like further information concerning these publications, or if you wish to request data not included in the publications, please write to: If you would like further information concerning these publications, or if you wish to request data not included in the publications, please write to:
Criminal Justice Statistics Center
4949 Broadway
P. O. Box 903427
Sacramento, CA 94203-4270
Attn: Special Requests Section, Room E203
 Go to CJSC Home Page. Go to CJSC Home Page.
 Back to CJSC Publications Listing. Back to CJSC Publications Listing.
 Go to AG Home Page. Go to AG Home Page.
042497
|

